
Module 5 · Lesson 1 of 17 · Order flow and auction market theory · About 6 minutes
Auction Market Theory Basics: Balance, Value, Rotation
On this page
- What you will learn
- What is Auction Market Theory?
- How is a market a two-way auction?
- What is value in auction terms?
- What are balance and imbalance?
- Auction Market Theory diagram
- What is rotation?
- What is the difference between initiative and responsive activity?
- How do participants on different timeframes fit in?
- What this does not tell you about Auction Market Theory
- Method in Practice
- Check yourself
- Reflect on your own process
- Sources
Before you read: Trading Volume Explained: Volume vs Open Interest
What you will learn
- Why many traders describe markets as continuous two-way auctions.
- The difference between balance and imbalance, and what rotation looks like.
- What “value”, “initiative activity” and “responsive activity” mean in this framework.
This lesson covers the ideas behind auction thinking. The measurements built on them (point of control, value area, nodes) are in volume profile, and labels for whole sessions are in opening types and day types.
What is Auction Market Theory?
If a market is an auction, who is the auctioneer?
Auction Market Theory (AMT) is a way of describing how prices move, not a trading system. It grew out of work by J. Peter Steidlmayer, who traded at the Chicago Board of Trade (CBOT). His time-at-price chart was introduced there in the 1980s under a name now associated with CBOT (see the trademark note below), and today is often called a TPO profile. Other authors, including James Dalton, wrote about and extended the ideas. This lesson explains the concepts in our own words.
How is a market a two-way auction?
What happens to an auction when the price gets so high that nobody else bids?
Picture a classic auction. The auctioneer raises the price until only one bidder is left. AMT applies a similar idea to financial markets, with one difference: the auction runs in both directions at once. Buyers and sellers are both present all the time.
The core idea is that a market moves to facilitate trade, meaning it moves to find prices where buyers and sellers are both willing to do business.
- If price rises and buyers keep buying, the auction keeps going up.
- When price rises far enough that buyers stop buying (or sellers become eager), the upward auction runs out of participants. In AMT’s description, price then turns around to look for business elsewhere, although it can also pause or keep going.
- The same is true going down.
In this view, price moves to find participants. A price that brings no trade is, in auction terms, a price the market has “rejected” at that moment.
What is value in auction terms?
Is the price where most trading happened the same as what something is worth?
In AMT, value is the price area where most trading took place over a period. It is the zone both sides accepted as fair enough to trade a lot of volume. (The next lesson, Volume Profile, shows one way to measure it with the value area.)
Value is not the “true worth” of the asset in an investing sense. It is simply where the bulk of business happened. Value can move from day to day as new information arrives and participants change their minds.
Two related words:
- Acceptance: price spends time and trades volume at a level. The market treats that price as fair while price stays there.
- Rejection: price touches a level briefly and leaves quickly, with little volume. The market did not accept that price, at least at that moment.
What are balance and imbalance?
What would a market look like if buyers and sellers mostly agreed? What if they did not?
AMT describes two broad states.
Balance. Buyers and sellers broadly agree on value. Price moves back and forth inside a range. This is also called a range or bracket. Markets can spend long periods in balance, and the amount varies by market and period.
Imbalance. One side is much more eager than the other, often after new information. Price moves directionally until it finds a new area where the other side is willing to trade. Then a new balance can form at the new level.
Auction market theory describes markets as alternating: balance, then imbalance, then a new balance (opening types and day types labels balanced and trend days). The order flow meaning of “imbalance” is different; see order flow basics. Different timeframes can be in different states at the same time. A market can be in balance on the daily chart while trending inside one session.
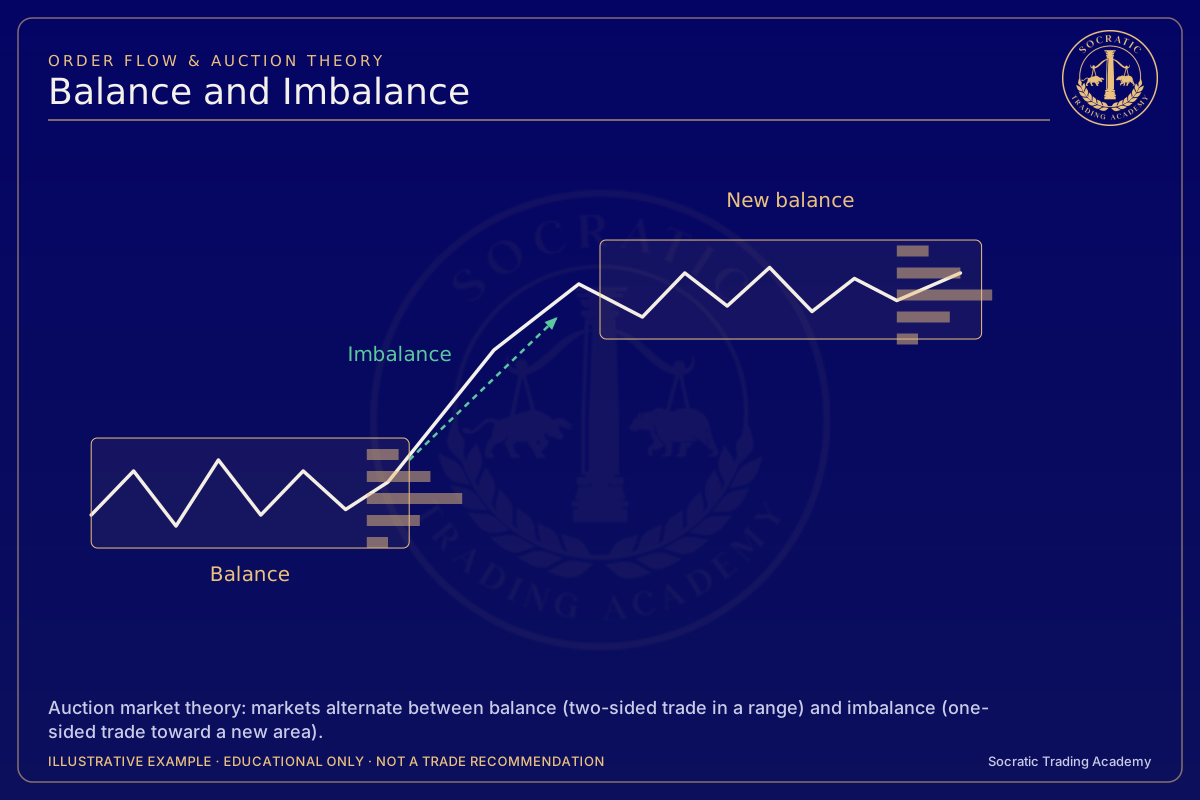
Auction Market Theory diagram

Illustrative diagram constructed for teaching. Not real market data.
The diagram shows a constructed path showing a balance range with rotations, a move out (imbalance), and a new balance at a higher level. Labels mark value, acceptance and rejection. It is constructed for teaching and is not real data.
What is rotation?
Inside a range, what makes price turn around at each end of the range?
A rotation is a swing from one side of a range to the other: price moves up, runs out of buyers, moves down, runs out of sellers, and so on. In a balanced market you see repeated rotations. Traders sometimes count rotations or measure their size to describe how active the auction is.
What is the difference between initiative and responsive activity?
Buying below value and buying above value both push price up. Why label them differently?
AMT separates activity by where it happens relative to value.
Responsive activity happens when participants react to price moving away from value: buying when price is below value (they see it as cheap) or selling when price is above value (they see it as expensive). In the AMT model, responsive activity is the kind associated with price returning toward value.
Initiative activity happens when participants act in the direction away from value: buying above value or selling below value. It shows participants willing to pay up or sell down, and it is associated with price moving to a new area.
These labels describe location and behavior. They do not reveal who the participants are or what they intend, and they are only clear in hindsight once you see whether value moved.
How do participants on different timeframes fit in?
Why might a trader holding for minutes and a fund holding for months see the same price differently?
AMT writers often describe participants by how long they plan to hold:
- Very short-term traders (seconds to minutes), who supply much of the day-to-day back-and-forth.
- Day traders, who close by the end of the session.
- Longer-timeframe participants (days to months), such as funds adjusting positions, whose larger orders AMT writers link to the bigger moves that shift value.
This is a simplification. You cannot see from a chart which group traded. It is a mental model for why some moves stay inside a range and others carry price to a new area.
What this does not tell you about Auction Market Theory
- AMT describes behavior. It does not say when balance will end or which way imbalance will go.
- “Value” is a description of where volume traded, not a fair-value estimate of the asset.
- Initiative and responsive labels are interpretations of location, not proof of anyone’s intent.
- Different traders draw ranges and value differently, so two people can describe the same day differently.
Method in Practice: balance or imbalance first
Fictional example. John, Harbor Index futures, the prices, times, costs and results are all invented for teaching. This shows how a written plan can be built and tested. It is not a recommendation, and nothing here says how often this idea works.
Try it on a real chart. Test this idea yourself on past sessions with bar replay. Keep your own count, including the days with no trade.
The idea. Before John looks for any setup, he labels the market's state: balance (rotating inside a range) or imbalance (moving to find a new one). Each state gets a different plan. In balance, this plan responds at the edge of the range. If price leaves the range, the plan is wrong, because the state has changed.
John's plan
- Setup
- five sessions rotating between 98.00 and 101.00 (fictional balance)
- Enter if
- price trades above 100.80, then a 30-minute period closes back below 100.80. Sell.
- Wrong if
- a 30-minute period closes above 101.10, outside the range
- Manage
- take half at 99.50 (middle of the range), the rest at 98.40 or by 14:30
- Risk
- $150 maximum, costs included
Three outcomes
-
Worked: the edge held and price rotated back down → +$284
-
Failed: price closed outside the range, and the balance broke → −$124, inside the limit
-
No trade: price never reached the edge → $0
Show the full replays
| Item | Plan |
|---|---|
| Context | Five sessions between 98.00 and 101.00; value near 99.50 |
| Entry condition | Price trades above 100.80, then a 30-minute period closes below 100.80. Sell 2 at market after that close |
| Wrong if | A 30-minute period closes above 101.10. Exit at market after that close |
| Management | Take profit on half at 99.50 (limit) and move the exit for the rest to the entry price (stop). Rest at 98.40 (limit). Time limit: exit what's left at 14:30 CT |
| Risk cap and size | $150. Exiting just above 101.10 is planned to cost about $55 per contract, so 2 contracts |
| Not trading if | Scheduled major release within the hour, or no setup by 12:00 CT |
Replay A: worked
| Time (CT) | What happened | John |
|---|---|---|
| 08:30–09:00 | Opens 100.40, trades up to 100.95, closes 100.88 | Above 100.80, but the close is above too. Waits |
| 09:00–09:30 | High 100.98, closes 100.72 | Condition met: sells 2 at market, filled 100.67 |
| 09:30–11:10 | Rotates down, trades 99.50 at 11:10 | Buys back 1 at 99.50 (limit). Exit for the other moves to 100.67 |
| 11:10–14:30 | Low 98.70, never 98.40, never back to 100.67 | At 14:30 buys back the last 1 at market: price 98.85, filled 98.90 |
Result after costs: +1.17 point = +$117, +1.77 points = +$177, commissions −$10. Net +$284. Journal: "The rotation came back to the middle and past it. The low was 98.70, 0.30 short of 98.40, so the time limit closed the rest. No change."
Replay B: failed
| Time (CT) | What happened | John |
|---|---|---|
| 08:30–09:00 | Opens 100.60, high 100.90, closes 100.75 | Condition met: sells 2 at market, filled 100.70 |
| 09:00–09:30 | Breaks up to 101.30, closes 101.22 | Wrong-if met: buys back 2 at market, filled 101.27 |
| 09:30–15:00 | Keeps going to 102.40. A new auction starts above the old range | Done for the idea |
Result after costs: 2 × −0.57 point = −$114, commissions −$10. Net −$124, inside the $150 cap. Journal: "The balance broke on the first test. The plan's wrong-if did its job. The loss was bigger than the $55 estimate because the close was well past 101.10."
Replay C: no trade
| Time (CT) | What happened | John |
|---|---|---|
| 08:30–12:00 | Rotates 99.20–100.50 all morning, never above 100.80 | No setup. 12:00 cutoff: done |
Result: $0. Journal: "Price stayed in the middle of the range. Nothing to do at the middle."
Test it yourself
- Write your balance rule first: how many sessions, and how close together the highs and lows must be.
- Replay every range that met it, including the ones that broke on the first test.
- Count the breakouts as part of the result, not as exceptions.
Where it breaks
- A range is only obvious once it has been drawn. Early on, you're guessing.
- When new information arrives, balance ends without warning (the failed replay).
- The edges are your drawing. Move them by 0.20 and the results change.
Calculators: position sizerisk/rewardexpectancy
Reflection question: Before your last trade, did you write down whether the market was in balance or imbalance, and did your plan fit that state?
Check yourself
Reflect on these; there is no score.
- In auction terms, what does it mean when price spikes to a level and leaves within seconds on little volume? Hint: rejection versus acceptance.
- Can a market be balanced and imbalanced at the same time? How? Hint: different timeframes.
- Buying below value and buying above value both put upward pressure on price. Why does AMT label them differently? Hint: responsive versus initiative, and location relative to value.
- Why is “value” in AMT not the same as an investor’s idea of what an asset is worth? Hint: it is built from where volume traded.
Trademark note. Market Profile is a name associated with the Chicago Board of Trade (CBOT), now part of CME Group. CBOT and Chicago Board of Trade are trademarks of Board of Trade of the City of Chicago, Inc. Socratic Trading Academy is not affiliated with, sponsored by or endorsed by CME Group or CBOT.
Reflect on your own process
- When you write "value" or "balance" in your journal, what exact measurement and settings does your note record?
- Which auction-theory labels in your review notes are observations, and which are interpretations you could not check from the chart?
- How would you verify a claim about who was trading before you wrote it into your notes?
- Before your last trade, did you write down whether the market was in balance or imbalance, and did your plan fit that state?