
Module 5 · Lesson 4 of 17 · Order flow and auction market theory · About 7 minutes
Order Flow Basics: DOM, Time and Sales, Delta
On this page
- What you will learn
- What are passive and aggressive orders?
- What is the DOM (depth of market)?
- What is time and sales?
- What is delta in order flow?
- Bid and ask volume diagram
- What are absorption and imbalance?
- What is a bid/ask volume chart?
- What are spoofing and iceberg orders?
- What are the limits of retail order flow data?
- What this does not tell you about order flow
- Method in Practice
- Check yourself
- Reflect on your own process
- Sources
Before you read: Volume Profile Explained: POC, Value Area, HVN, LVN
What you will learn
- What the order book (DOM) and time and sales show, and how aggressive and passive orders differ.
- What bid/ask volume, delta, cumulative delta, absorption and imbalance mean, and how bid/ask volume charts (often called footprint charts) display them.
- Why order flow readings are interpretations, and the real limits of retail order flow data.
What are passive and aggressive orders?
Every trade needs two sides. Which side was waiting, and which side arrived?
The order types themselves are covered in order types explained, and the totals they add up to in trading volume. A volume profile sums the same trades by price across a whole session; this lesson looks inside the individual trades.
- A passive order rests in the market, waiting. A limit order to buy below the current price, or to sell above it, is passive. Passive orders supply liquidity.
- An aggressive order (the aggressor) trades right away against resting orders. A market order, or a limit order priced to cross the spread, is aggressive. Aggressive orders take liquidity.
The bid, ask and spread are explained in how markets work.
When an aggressive buyer trades against resting sell orders, the trade usually prints at the ask. When an aggressive seller trades against resting buy orders, it usually prints at the bid.
What is the DOM (depth of market)?
What can a list of waiting orders tell you, and what can it hide?
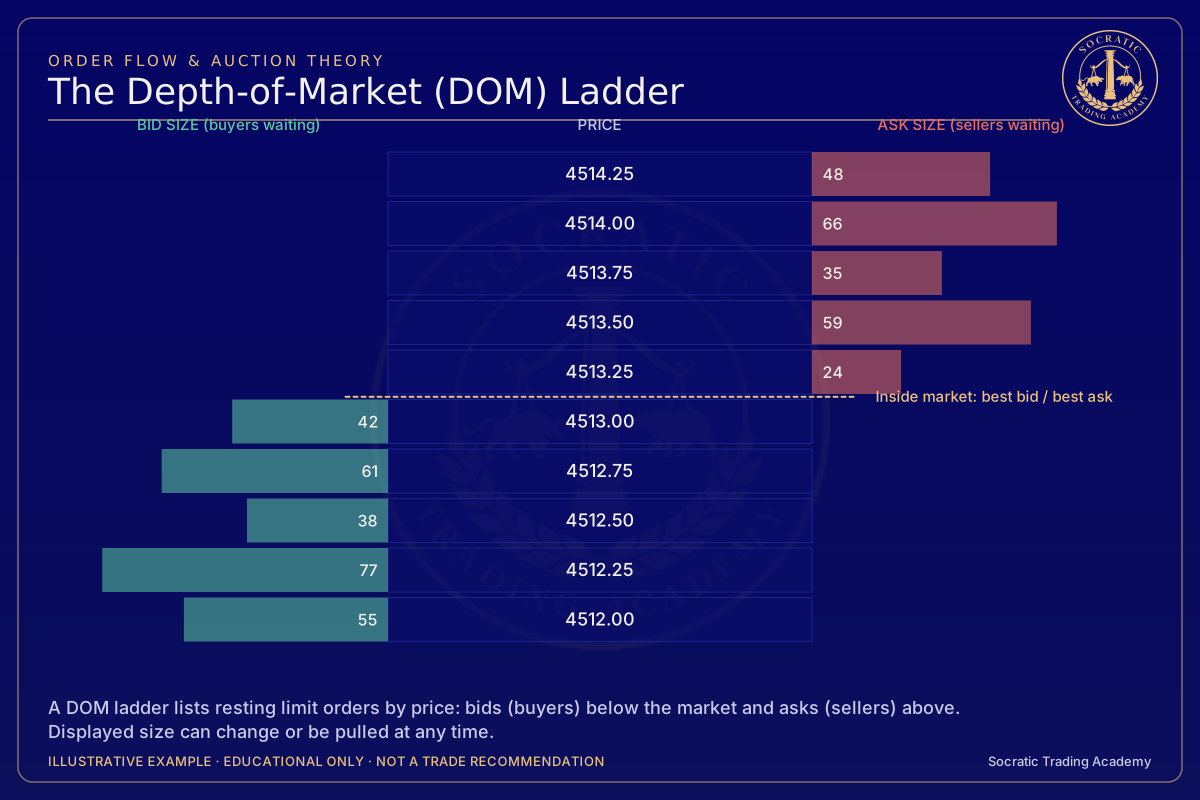
The order book lists resting limit orders at each price. The DOM (depth of market, sometimes called the ladder) displays it as a vertical column: prices in the middle, resting buy quantities on one side, resting sell quantities on the other.
The DOM shows intentions that can change. Resting orders can be added, reduced, or canceled at any moment, often in milliseconds. A large quantity sitting at a price is not a promise that it will still be there when price arrives.
Many retail feeds show only a limited number of price levels on each side, not the full book.
What is time and sales?
What is the difference between what might trade and what did trade?
Time and sales (also called the tape) is a running list of completed trades: time, price, size, and often whether the trade was at the bid or ask. The DOM shows what might trade. Time and sales shows what did trade.
What is delta in order flow?
If every contract bought was also sold, what does it mean to say “more buying”?
Using the bid-or-ask classification, traders split volume into two parts:
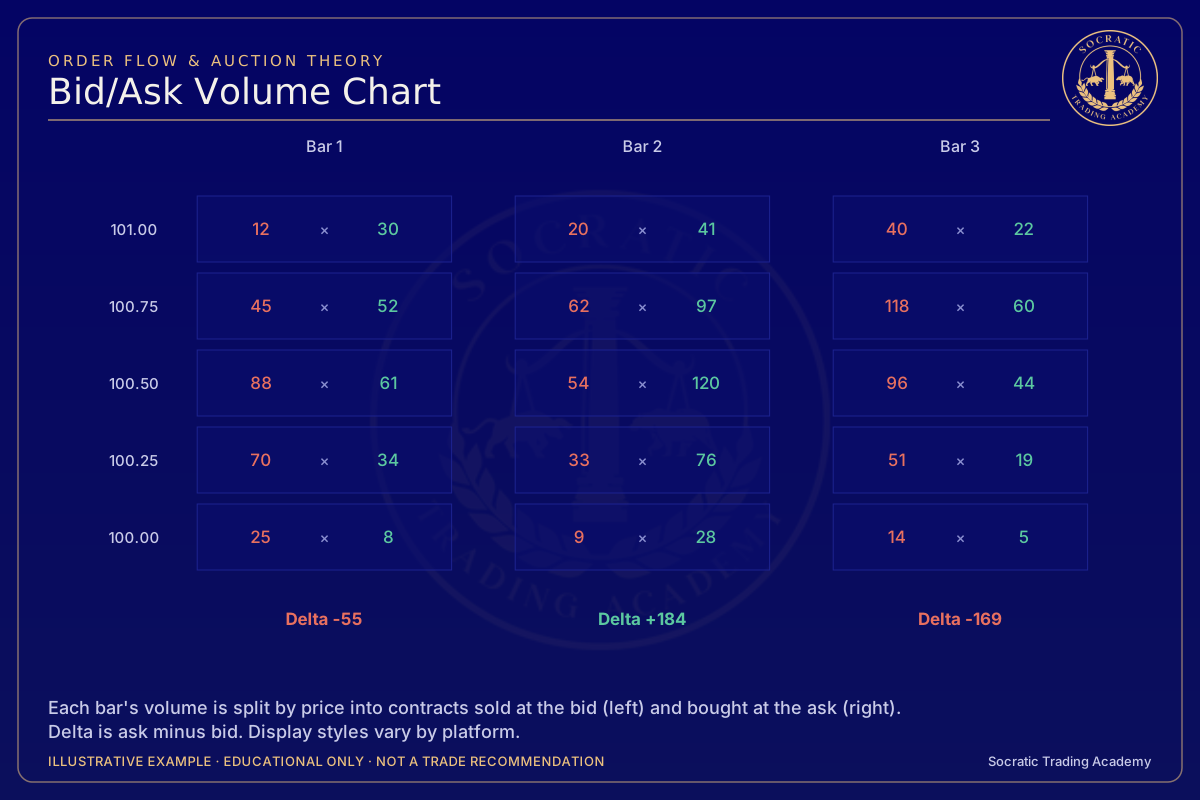
- Ask volume: contracts traded at the ask, usually read as aggressive buying.
- Bid volume: contracts traded at the bid, usually read as aggressive selling.
Delta is ask volume minus bid volume for a bar or price level. A positive delta means more volume traded at the ask than at the bid.
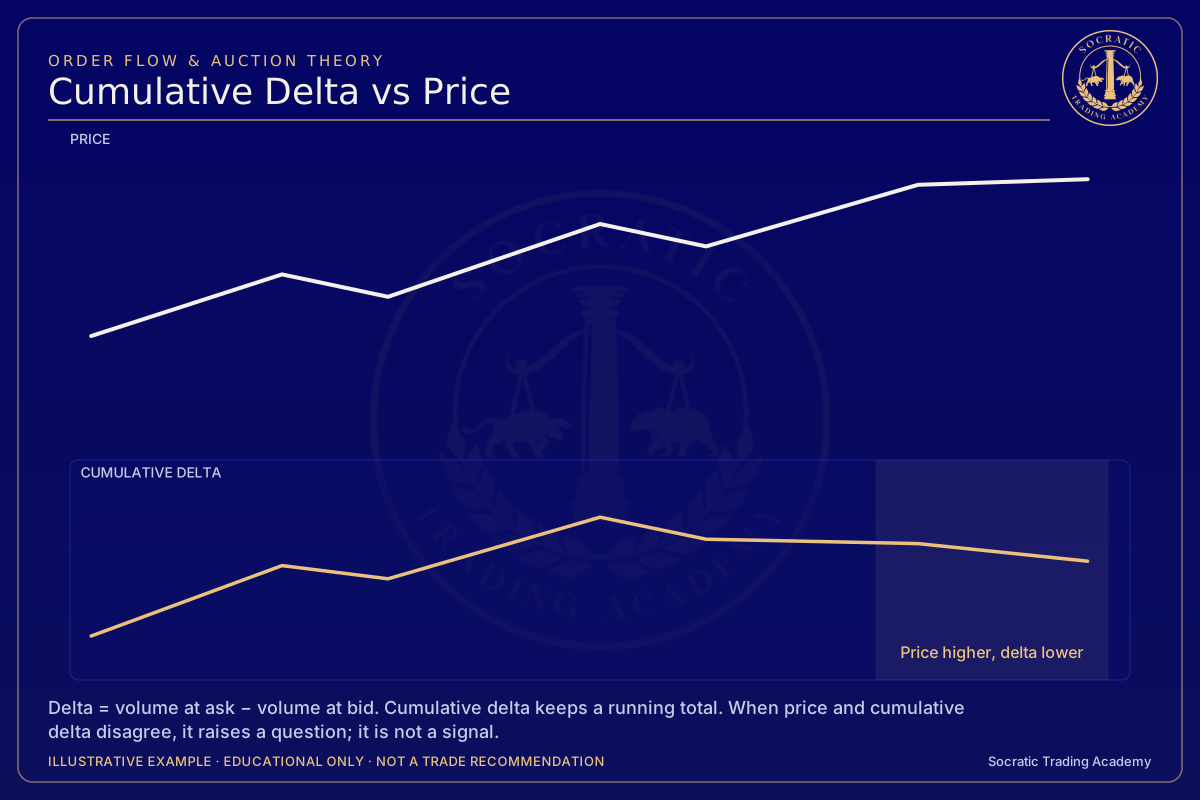
Cumulative delta adds up delta bar by bar over a session. It is drawn as a line that rises when more volume trades at the ask and falls when more trades at the bid.
Delta is an interpretation, not a fact about intent. Every contract bought at the ask was also sold by someone resting there. A large positive delta could come from many small aggressive buyers, from short sellers buying back (covering) their positions, or from algorithms; you cannot tell which. Classification is data-mode dependent. Some feeds supply exchange/provider aggressor-side information; other systems infer side from trade/quotes, tick direction or aggregated intrabar movement. Missing classifications and fallback rules matter. An exchange-reported side identifies the initiating side as reported, not trader identity, motive, opening versus closing, or guaranteed complete coverage. Delta is the difference between the stated side categories for the stated sample; when categories are estimates, it is an estimated directional-volume measure. See Bid/Ask Volume Charts: Reading Volume at the Bid and Ask by Price for the scoped platform/mode example.
The contracts in these examples could be futures, which are leveraged products. Leverage can cause losses larger than the amount invested.
Bid and ask volume diagram

Read the diagram step by step
- Row spacing: 0.25 price points. Bid/ask units: contracts.
- ask at one price vs bid one row lower, e.g. ask 75 at 100.00 vs bid 48 at 99.75. 75/48 = 1.5625.
- Conventions differ by vendor: some compare same-row, many compare diagonally, and the ratio that counts as an "imbalance" is a user setting.
- SEPARATE quote snapshot
- Not the bar’s contemporaneous quotes.
Illustrative diagram constructed for teaching. Not real market data.
Fictional accumulated footprint cells are not a snapshot of the bid/ask spread. Diagonal neighbor selection is a display convention; classification/feed settings determine the measured categories.
The example accumulates one fictional bar across four price rows at 0.25-point spacing. A diagonal comparison pairs the ask/buy category at one row with the bid/sell category one row lower; it is a selected display calculation, not proof those prices were simultaneous best quotes. Here 75 at 100.00 compares with 48 at 99.75: 75/48=1.5625. A same-row comparison at 100.50 instead gives 40/12≈3.3333. No imbalance flag is determined without a declared threshold/comparison rule.
A separate instantaneous toy quote with minimum price increment 0.25 could have best bid 99.75/best ask 100.50: spread 0.75=3 ticks. Thus the grid increment and quote spread are different. The quote snapshot is NOT reconstructed from the bar’s accumulated cells. Across the original bar, ask 40+60+75+20=195 and bid 12+55+80+48=195, so delta 0. A row-level comparison need not have the sign of total delta. Row size can also aggregate several minimum ticks; record that setting.
What are absorption and imbalance?
What does it look like when heavy trading barely moves price?
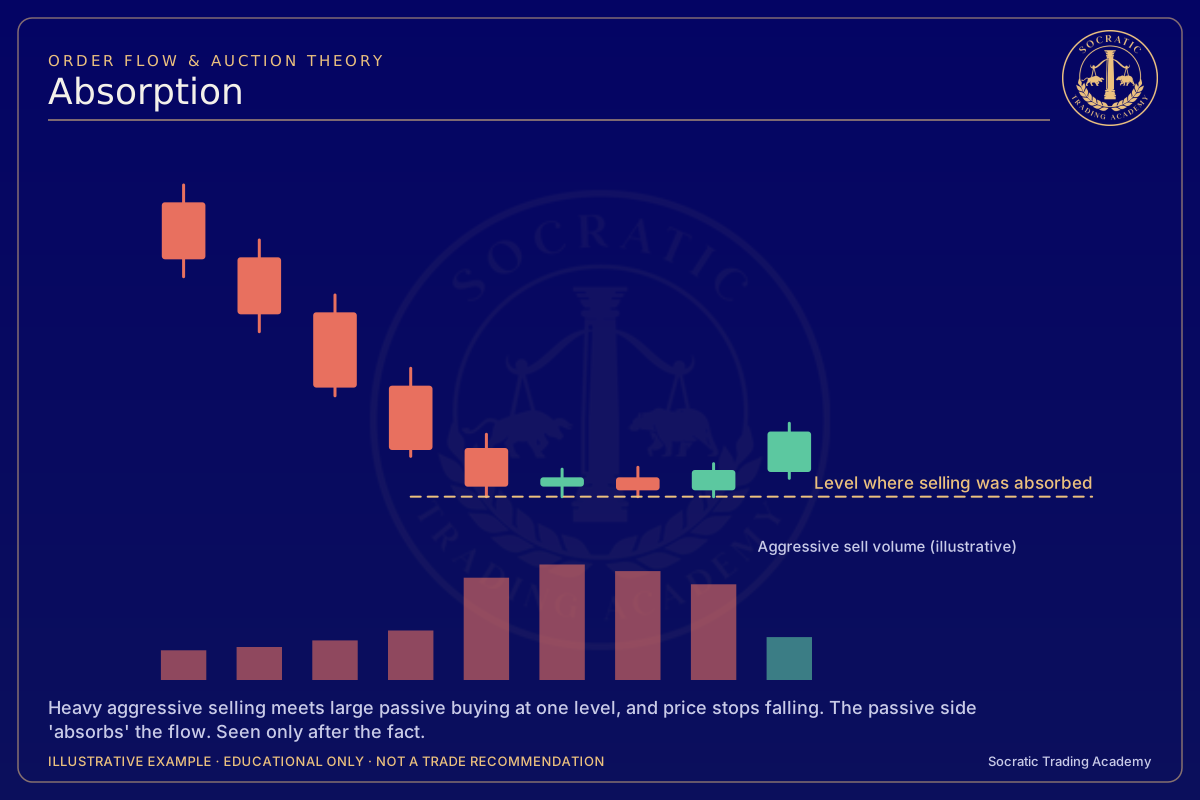
Absorption describes a situation where heavy aggressive volume hits one side, but price does not move much. For example, a lot of volume trades at the ask yet price stays put. Some traders read this as large passive orders (possibly refilled as they are hit) soaking up the aggression. It is an interpretation; the same picture can come from other causes.
Imbalance, in order flow tools, usually means that at a given price the volume on one side was much larger than on the other, by a ratio the user sets (for example, three times). This differs from the broader auction meaning of imbalance in Auction Market Theory, so check which one a writer means.
What is a bid/ask volume chart?
What would you see if you opened up a single candle and looked inside?
A bid/ask volume chart, often called a footprint chart, shows inside each bar the bid volume and ask volume at every price traded. Platforms give it different names; Footprint is a registered trademark of its owner. Think of it as a volume profile and delta combined for each bar.
What are spoofing and iceberg orders?
If displayed orders can be fake or partly hidden, how much does the book really show?
Two things make the order book harder to read.
- Spoofing means placing a bid or offer while intending, at the time it is placed, to cancel it before it executes. It is usually done to give other traders a false picture of supply or demand. In US futures markets, the Commodity Exchange Act prohibits spoofing (CEA section 4c(a)(5)(C), added by the Dodd-Frank Act in 2010). The CFTC and exchanges have brought enforcement actions over it, and the Justice Department has prosecuted knowing violations as crimes. Canceling or changing an order is not spoofing by itself. Traders do it constantly, and the CFTC has said that legitimate, good-faith cancellations and modifications are not violations. What matters is the trader’s intent when the order was placed. For anyone reading an order book, the practical point is that displayed size is not a reliable guide to real intent.
- Iceberg orders show only part of their size. When the visible part trades, more is shown. A price can look thin on the DOM while a large hidden order sits there. Some exchanges support display-quantity orders directly, and platforms can also slice orders this way.
What are the limits of retail order flow data?
How complete and how current is the data on your screen?
- Delayed or aggregated data. Some retail feeds batch trades, combine several prints into one, or show a delayed or limited book.
- Vendor-specific calculations. Delta, imbalance and bid/ask chart values depend on each vendor’s rules. Two platforms can show different numbers for the same bar.
- Partial view. The DOM shows only displayed orders, and only some levels. Hidden size, canceled orders and activity in related markets (other contract months, ETFs, options) are not visible.
- Speed. Some automated participants react far faster than a person can. A human watching a screen sees a picture that is already out of date.
What this does not tell you about order flow
- Delta does not tell you who traded or why.
- A large order on the DOM can vanish before price reaches it.
- Absorption and imbalance are labels for patterns, not proof of large participants.
- Order flow readings describe the moment; they do not predict the next move.
Method in Practice: the tape at a planned level
Fictional example. John, Harbor Index futures, the prices, times, costs and results are all invented for teaching. This shows how a written plan can be built and tested. It is not a recommendation, and nothing here says how often this idea works.
Try it on a real chart. Test this idea yourself on past sessions with bar replay. Keep your own count, including the days with no trade.
The idea. Some traders use order flow only as a check at a level they already marked, never as a signal on its own. John's level is the prior day's low. His rule asks for price to come back above the zone and for the bar's delta to be positive. Delta counts who crossed the spread, not who was right, so the plan still needs a "wrong if".
John's plan
- Setup
- prior day low 99.50; John's zone 99.40–99.60
- Enter if
- price trades into the zone, then a 5-minute bar closes above 99.60 with positive bar delta. Buy.
- Wrong if
- a 5-minute bar closes below 99.35
- Manage
- take half at 100.10, the rest at 100.60 or by 14:30
- Risk
- $150 maximum, costs included
Three outcomes
-
Worked: price held the zone and rose → +$118
-
Failed: positive delta at the level, then price fell through → −$98, inside the limit
-
No trade: the bar closed above the zone, but delta was negative → $0
Show the full replays
| Item | Plan |
|---|---|
| Context | Prior day low 99.50. Zone 99.40–99.60, marked on the pre-session map |
| Entry condition | Price trades at or below 99.60, then a 5-minute bar closes above 99.60 with bar delta above zero. Buy 2 at market after that close |
| Wrong if | A 5-minute bar closes below 99.35. Exit at market after that close |
| Management | Take profit on half at 100.10 (limit) and move the exit for the rest to the entry price (stop). Rest at 100.60 (limit). Time limit 14:30 CT |
| Risk cap and size | $150. Exiting just under 99.35 is planned to cost about $50 per contract, so 2 contracts |
| Not trading if | Scheduled major release within the hour, or no setup by 12:00 CT |
Replay A: worked
| Time (CT) | What happened | John |
|---|---|---|
| 10:00–10:05 | Falls into the zone, low 99.45 | Watching |
| 10:05–10:10 | Closes 99.66, bar delta +240 | Condition met: buys 2 at market, filled 99.71 |
| 10:10–11:20 | Rises, trades 100.10 at 11:20 | Sells 1 at 100.10 (limit). Exit for the other moves to 99.71 |
| 11:20–13:40 | Never back to 99.71, trades 100.60 at 13:40 | Sells the last 1 at 100.60 (limit) |
Result after costs: +0.39 point = +$39, +0.89 point = +$89, commissions −$10. Net +$118. Journal: "Level, close and delta all lined up. Both exits were limits."
Replay B: failed
| Time (CT) | What happened | John |
|---|---|---|
| 09:40–09:45 | Low 99.42 | Watching |
| 09:45–09:50 | Closes 99.64, bar delta +310 | Buys 2 at market, filled 99.69 |
| 09:50–09:55 | Drops, closes 99.30 | Wrong-if met: sells 2 at market, filled 99.25 |
| 09:55–15:00 | Falls to 98.80 | Done for the idea |
Result after costs: 2 × −0.44 point = −$88, commissions −$10. Net −$98. Journal: "Strong positive delta, then price fell through the zone. Delta told me who crossed the spread, not what came next."
Replay C: no trade
| Time (CT) | What happened | John |
|---|---|---|
| 10:20–10:25 | Low 99.55 | Watching |
| 10:25–10:30 | Closes 99.70, bar delta −150 | Delta negative: condition not met |
| 10:30–12:00 | Rises to 100.40 without another visit to the zone | No trade. 12:00 cutoff |
Result: $0. Journal: "The filter kept me out of a move up. That's its cost; the weekly review counts both kinds."
Test it yourself
- Write the zone, bar length and delta rule first, and check which trade classification your platform uses (Reading Delta and Imbalance on a Bid/Ask Volume Chart).
- Replay every visit to a marked level. Log the visits where delta was positive and price still failed.
- Compare results with and without the delta condition. If they barely differ, the condition adds nothing.
Where it breaks
- Positive delta can come right before a drop (the failed replay). It counts aggression, not outcome.
- Two platforms can show different delta for the same bar.
- Fast markets move past the zone before a 5-minute bar closes.
Calculators: position sizerisk/rewardexpectancy
Reflection question: When you look at order flow, do you already know which level you're watching and why?
Check yourself
Reflect on these; there is no score.
- Why is it true that every contract bought at the ask was also sold? Hint: every trade has two sides; one was resting.
- Two platforms show different cumulative delta for the same session. Name two possible reasons. Hint: trade classification rules and data aggregation.
- What could make a price look thin on the DOM even though a lot will trade there? Hint: icebergs.
- Why do some traders read displayed resting orders with caution? Hint: cancellations and spoofing.
- Does a diagonal comparison of neighboring rows prove the best spread was one tick?
- If a data feed supplies aggressor side, is delta then trader identity or a reason to trade?
Trademark note. Footprint is a registered trademark of its owner. ‘Bid/ask volume chart’ is used here as a generic description.
Reflect on your own process
- Which data mode and classification method does your platform use for delta, and where have you written that down?
- What does your checklist say to record before you describe a displayed order as large or meaningful?
- How would you check a vendor's order flow numbers against its own documentation before relying on them in your notes?
- When you look at order flow, do you already know which level you're watching and why?
Sources
- Volume footprint charts: a complete guide
- Antidisruptive Practices Authority: Interpretive Guidance and Policy Statement (78 FR 31890, May 28, 2013)
- CFTC Orders The Bank of Nova Scotia to Pay $127.4 Million for Spoofing, False Statements, Compliance and Supervision Violations (Release 8220-20, Aug. 19, 2020)
- Federal Court Sanctions Australian Trader for Spoofing and Engaging in a Manipulative and Deceptive Scheme (Release 8395-21, June 11, 2021)
- Regulatory Circular RG11-016: Reserve Orders (Jan. 27, 2011)
- Futures Market Basics