
Module 3 · Lesson 6 of 13 · Reading price · About 6 minutes
Chart Patterns Explained: Flags, Triangles, Double Tops
On this page
- What you will learn
- What is a chart pattern?
- What are flags and pennants?
- What are triangle patterns?
- What are double tops and double bottoms?
- What is a head and shoulders pattern?
- Chart patterns diagram
- What is a price channel?
- What are breakouts and false breaks?
- What are the limits of chart patterns?
- What this does not tell you about chart patterns
- Method in Practice
- Check yourself
- Reflect on your own process
- Sources
Before you read: Market Structure Explained: Swings, BOS and CHoCH
What you will learn
- How to describe common chart patterns as sequences of swings: flags, triangles, double tops and bottoms, head and shoulders, and channels.
- What a breakout and a false break are, in descriptive terms.
- Why pattern recognition is subjective, and what that means for any claim about patterns.
What is a chart pattern?
When you see a shape in a chart, are you finding something or drawing something?
A chart pattern is a named arrangement of swing highs and swing lows over several candles. If market structure is the sentence-by-sentence reading of swings, patterns are named paragraphs: recognizable groups of swings that people have given labels to.
Like candle names, pattern names are shared vocabulary. They make it quick to say “this looks like a triangle” instead of describing every swing. They are not discoveries about how markets must behave, and their definitions are loose. This lesson describes each pattern in terms of the swings that make it up, so you can check whether it is really there.
What are flags and pennants?
What does it look like when a strong move rests?
A flag has two parts:
- the pole: a fast, fairly straight move over a few candles, and
- the flag: a smaller, shorter drift that slopes gently against the pole or moves sideways, often in a narrow channel.
A pennant is similar, but the resting part narrows into a small triangle instead of a parallel channel.
Plain description: a burst of movement followed by a period of smaller, overlapping candles. Some traders read a flag as a pause in an ongoing move. Others note that the pause can just as easily become a reversal. The shape itself does not decide which.

Bull Flag. Bull flag is a traditional continuation-shape category, not a quantified continuation forecast; other outcomes remain possible.
CHART PATTERNS
Traditionally grouped as a continuation-pattern shape; the label does not measure continuation probability. The pause can also lead to reversal or a range.
ILLUSTRATIVE EXAMPLE · EDUCATIONAL ONLY · NOT A TRADE RECOMMENDATION
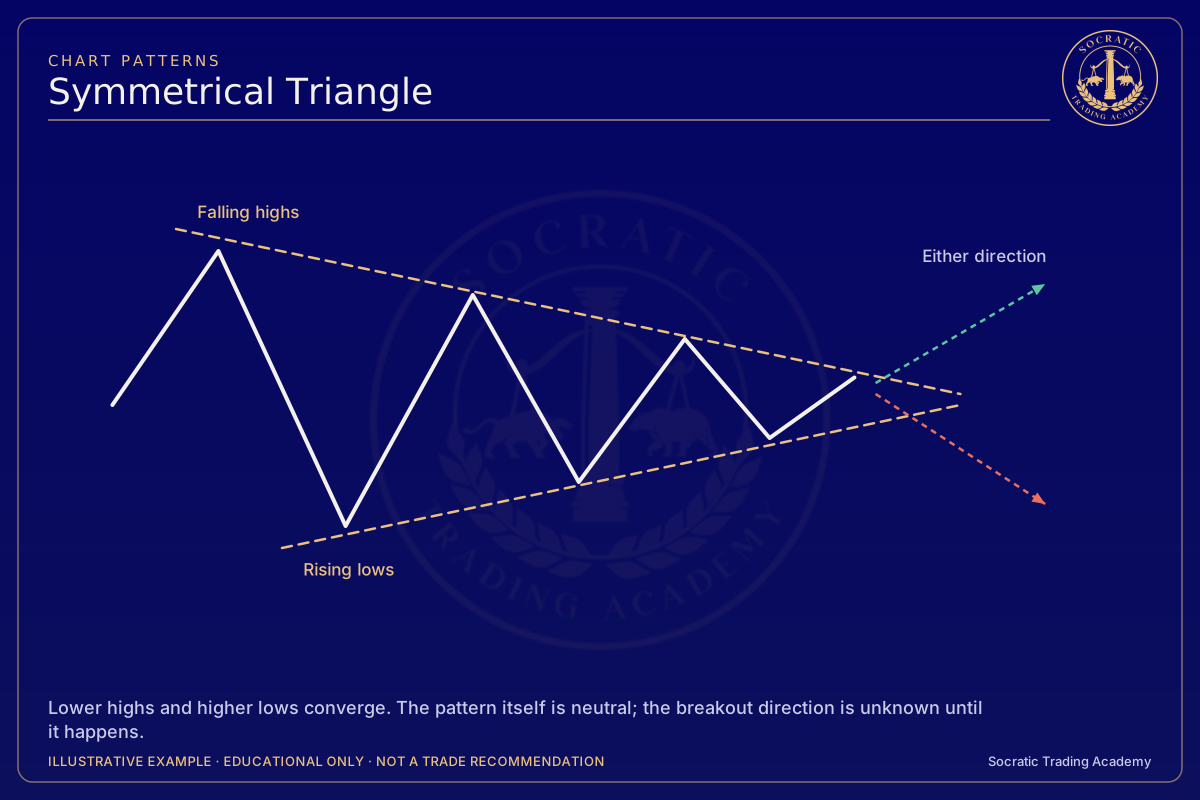
What are triangle patterns?
What does it mean when each swing is smaller than the last?
A triangle forms when swing highs and swing lows draw closer together over time. Three versions are commonly named:
- Symmetrical: lower highs and higher lows, converging from both sides.
- Ascending: swing highs at roughly the same level, with rising swing lows.
- Descending: swing lows at roughly the same level, with falling swing highs.
Plain description: the range of each swing is shrinking. Eventually price leaves the converging lines in one direction or the other, or the shape simply fades into a range. Drawing the lines involves choices: which swings to connect, and whether to use wicks or closes.
What are double tops and double bottoms?
If price reaches the same area twice and turns both times, what has happened, and what has not?
A double top is two swing highs at about the same level, with a pullback low between them. A double bottom is the mirror: two swing lows at about the same level with a rally high between them.
The low between the two tops (or the high between the two bottoms) is often called the neckline. Many descriptions say the pattern is only complete if price later moves through the neckline; before that, it is just two highs at a similar level. This links directly to support and resistance: a double top is a zone that was tested twice.

Double Top. This double-top drawing uses a close-below-middle-trough completion variant; declare any other rule separately.
CHART PATTERNS
This drawing uses a close-below-middle-trough completion convention; other definitions must state their own boundary/confirmation rule.
ILLUSTRATIVE EXAMPLE · EDUCATIONAL ONLY · NOT A TRADE RECOMMENDATION
What is a head and shoulders pattern?
How is a head and shoulders different from a double top with an extra peak?
A head and shoulders is three swing highs in which the middle one (the head) is higher than the two on either side (the shoulders). A line drawn through the lows between them is the neckline. The inverse version is the mirror: three swing lows, the middle one lowest.
Plain description: a rise to a high, a higher high, then a lower high, which in structure terms is a sequence that stops making higher highs (market structure calls the shift a change of character). Real examples rarely look as tidy as textbook drawings. Shoulders differ in height and width, and necklines slope.
Chart patterns diagram

Illustrative diagram constructed for teaching. Not real market data.
The diagram shows small constructed sketches of a flag, a symmetrical triangle, a double top, a head and shoulders and a rising channel, each labeled with the swings that define it. It is constructed for teaching and is not real market data.
What is a price channel?
What would you need to see before calling something a channel rather than a coincidence?
A channel is a rising, falling or sideways move contained between two roughly parallel lines, one through the swing highs and one through the swing lows. A sideways channel is another word for a range.
Plain description: price has rotated between two boundaries several times. A channel with more touches is easier to spot, so more chart readers may notice it. Channels drawn on a linear scale and on a logarithmic scale can look different for long moves.
What are breakouts and false breaks?
When price crosses a line you drew, has something changed, or has price just crossed a line?
A breakout is a move beyond a pattern boundary or level. A false break (or fakeout) is a move beyond it that quickly returns inside. Since the definitions depend on where the line was drawn, on whether wicks or closes count and on how quickly “quickly” is, the same move can be called a breakout by one person and a false break by another.
What are the limits of chart patterns?
If two careful people can disagree about whether a pattern exists, what does that say about claims of how often patterns work?
- Subjectivity. Patterns are identified by eye, and different people draw them differently. Automatic pattern scanners use their own definitions, which may not match yours.
- Survivorship in examples. Textbook examples are chosen because they turned out cleanly. The many shapes that started similarly and went nowhere are rarely shown.
- No fixed outcome. Each pattern can be followed by movement in either direction, or by none. These lessons do not cite success rates; published figures depend on definitions, markets, periods and costs, and are hard to reproduce.
- Hindsight. A pattern is easiest to see after it has finished. In real time, the right side of the chart is blank.
Testing a pattern idea honestly requires precise rules written before looking at results; see plans, journaling and honest testing.
What this does not tell you about chart patterns
- Where price will go after any pattern.
- Whether a shape on your chart meets anyone else’s definition.
- How any pattern has performed in the past.
Method in Practice: a completion rule, and the count
Fictional example. John, Harbor Index futures, the prices, times, costs and results are all invented for teaching. This shows how a written plan can be built and tested. It is not a recommendation, and nothing here says how often this idea works.
Try it on a real chart. Test this idea yourself on past sessions with bar replay. Keep your own count, including the days with no trade.
The idea. A pattern is usually named after it finishes (this lesson). John writes his double-bottom definition and completion rule as numbers in advance. He also counts every case his rule finds, so he knows the base rate in his own sample (Why Chart Patterns Fail: Base Rates, Hindsight and Context).
John's plan
- Setup
- two 30-minute lows within 0.10 of each other, at least 6 bars apart. The neckline is the highest high between them
- Enter if
- a 30-minute period closes above the neckline. Buy.
- Wrong if
- a 30-minute period closes more than 0.20 below the neckline
- Manage
- take half at neckline + half the pattern height, the rest at neckline + the full height, or by 14:30
- Risk
- $150 maximum, costs included
Three outcomes
-
Worked: completed and carried → +$84
-
Failed: completed, then fell back → −$90, inside the limit
-
No trade: it looked like a double bottom, but the lows were 0.20 apart → $0
Show the full replays
| Item | Plan |
|---|---|
| Pattern | Lows 99.00 and 99.05 (within 0.10, 8 bars apart). Neckline 99.80. Height 0.80 |
| Entry condition | A 30-minute period closes above 99.80. Buy 2 at market after that close |
| Wrong if | A 30-minute period closes below 99.60. Exit at market after that close |
| Management | Half at 100.20 (+half the height) (limit), exit for the rest to entry (stop), rest at 100.60 (+the height) (limit). Time limit 14:30 CT |
| Risk cap and size | $150. Exiting just under 99.60 is planned to cost about $45 per contract, so 2 contracts |
| Not trading if | Scheduled major release within the hour |
Replay A: worked
| Time (CT) | What happened | John |
|---|---|---|
| 10:00–10:30 | Closes 99.88, above the neckline | Buys 2 at market, filled 99.93 |
| 10:30–11:30 | Trades 100.20 | Sells 1 (limit). Exit for the other moves to 99.93 |
| 11:30–13:10 | Never back to 99.93, trades 100.60 | Sells the last 1 (limit) |
Result after costs: +0.27 point = +$27, +0.67 point = +$67, commissions −$10. Net +$84.
Replay B: failed
| Time (CT) | What happened | John |
|---|---|---|
| 10:30–11:00 | Closes 99.85 | Buys 2 at market, filled 99.90 |
| 11:00–11:30 | Closes 99.55 | Wrong-if met: sells 2 at market, filled 99.50 |
Result after costs: 2 × −0.40 point = −$80, commissions −$10. Net −$90.
Replay C: no trade
| Time (CT) | What happened | John |
|---|---|---|
| Earlier | Lows 99.00 and 99.20, 0.20 apart | Not a double bottom by the rule |
| 10:00–12:00 | Closes above the high between them, then rises to 100.40 | No trade |
Result: $0. Journal: "Everyone would call that a double bottom. My rule didn't. The rule stays fixed during a test."
John's count across his test sample (invented numbers: this shows how to count, not how the method performs)
| Cases the rule found | Completed and reached +half the height | Completed and hit the wrong-if | Never completed |
|---|---|---|---|
| 30 | 11 | 12 | 7 |
Test it yourself
- Write the pattern as numbers: how close the lows, how far apart, what completes it.
- Have a script or a friend find every case in your sample, not just the ones you remember.
- Count all of them: completed and worked, completed and failed, never completed.
Where it breaks
- Patterns are named after they finish, so examples look better than live cases.
- Your definition may not match anyone else's.
- A completed pattern can fail straight away (the failed replay).
Calculators: position sizerisk/rewardexpectancy
Reflection question: If someone else applied your pattern definition, would they find the same patterns?
Check yourself
Reflect on these; there is no score.
- Describe a double top only in terms of swing highs and lows. Hint: two highs at a similar level and the low between them.
- What choices do you make when drawing a triangle’s lines, and how could they change the picture? Hint: which swings, wicks or closes.
- Why might the same move be called a breakout by one person and a false break by another? Hint: line placement and timing.
- Find a textbook-looking pattern on any chart. Then look for a similar shape that led nowhere. Which was easier to find? Hint: what gets remembered.
- Does “continuation pattern” establish how often a flag continues?
Reflect on your own process
- Which pattern definitions are written into your plan in enough detail that someone else would mark the same shape?
- When you collect pattern examples for review, how do you also record the similar shapes that went nowhere?
- Does your checklist say whether you draw pattern lines through wicks or closes, and on which price scale?
- If someone else applied your pattern definition, would they find the same patterns?