
Module 3 · Lesson 4 of 13 · Reading price · About 7 minutes
Market Structure Explained: Swings, BOS and CHoCH
On this page
- What you will learn
- What is market structure?
- What are the building blocks of market structure?
- Market structure diagram
- How do you mark market structure step by step?
- How do timeframes change market structure?
- Where does structure reading go wrong?
- Why write a structure description down?
- What this does not tell you about market structure
- Method in Practice
- Check yourself
- Reflect on your own process
- Sources
Before you read: Candlestick Anatomy: Open, High, Low, Close and Wicks
What you will learn
- How swing highs and swing lows combine into a sequence you can name: rising, falling or sideways.
- What a break of structure (BOS) and a change of character (CHoCH) describe, and what they do not.
- A three-pass routine for marking structure, and the most common ways the reading goes wrong.
What is market structure?
If you covered everything on a chart except the turning points, what could you still say about it?
Market structure is the pattern that a market’s swing highs and swing lows make over time. Reading it means asking a simple question: is each new swing higher, lower, or about the same as the last one? The answer gives you a plain description of the chart, whether rising, falling or sideways, without predicting what comes next.
What are the building blocks of market structure?
Which few facts would you need to describe a chart’s direction without adding opinion?
Four ideas do most of the work: swing points, the sequence they form, breaks in that sequence, and the zones where price has turned before.
1. Swing points
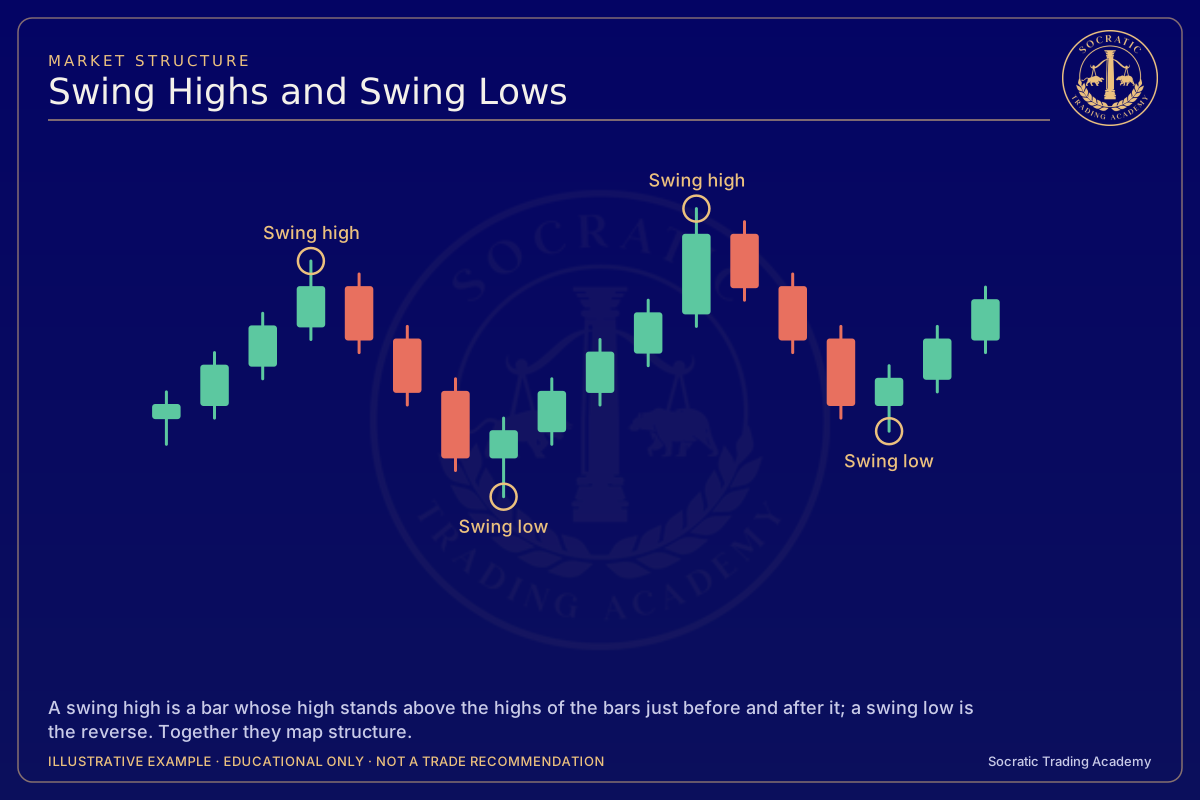
A bar counts as a swing high when its high is above the highs of the bars around it, and as a swing low when its low is below the lows of the bars around it. You decide what “around it” means. With a two-bar rule, a swing high needs two bars on each side with lower highs. With a five-bar rule, far fewer bars qualify, and only the larger turns remain. Neither rule is right; they describe the chart at different levels of detail.
2. The sequence
Once swings are marked, compare each one with the swing of the same kind before it.
- When each swing high and swing low is above the one before it, the sequence is described as an uptrend. The labels are HH (a high above the prior high) and HL (a low above the prior low).
- When each swing high and swing low sits under the one before it, the sequence is described as a downtrend, labeled LH and LL.
- A range is a stretch where swings keep turning near roughly the same upper and lower prices. The labels mix and no clear progression appears.
Real charts are messy. A rising sequence can include one swing low that is only level with the last one. Many traders allow a small tolerance rather than demanding a perfect pattern.
3. What is a break of structure vs a change of character?
Two labels describe what happens when price moves past an earlier swing.
- Break of structure (BOS): price trades past the latest swing in the same direction as the sequence, such as above the last swing high while highs and lows have been rising. It describes the existing sequence extending; it does not confirm that it will keep going.
- Change of character (CHoCH): the sequence is interrupted in the other direction, for example the first swing low that undercuts the prior one after a run of rising lows. It describes a possible turn. Changes of character are sometimes followed by the old trend resuming and sometimes by a new trend.
BOS and CHoCH come from online price-action communities; definitions vary between sources.
A breakout is related but different (see chart patterns): it is an event, a move outside a range or past a level, rather than a type of structure. After a breakout, the question is whether the new swings start forming outside the old area or whether price slips back inside.
Convention for this lesson: the basic definition uses a trade past the relevant swing price; equality is not “past.” A completed-bar-close-beyond rule is a separately declared, stricter variant, not a universal BOS/CHoCH requirement. The supporting drawings show closes beyond their levels, which also satisfy the basic trade-through criterion. Do not switch criteria after seeing the outcome.
For a completed fictional bar with O99.50, H100.25, L99.25, C99.75 and a previously confirmed swing high 100.00, a trade went 0.25 point above the level, but the close remained 0.25 point below it. It meets the trade-through test and fails a close-above test. Neither classification predicts continuation.
4. Zones where price turned
The prices where swings formed become reference areas. Places where falling price has turned up before are called support; places where rising price has turned down before are called resistance. These are better treated as zones than exact prices, and a zone that was broken sometimes plays the opposite role later. Support and resistance covers this in depth.

Break of Structure (BOS). BOS uses the body’s trade-through convention; this depicted close also finishes beyond. A close-confirmed variant must be declared separately.
Read the diagram step by step
- MARKET STRUCTURE
- Trade beyond the latest relevant swing in the sequence direction; shown close is also beyond.
- This drawing also illustrates a close-confirmed variant; declare it separately.
- ILLUSTRATIVE EXAMPLE · EDUCATIONAL ONLY · NOT A TRADE RECOMMENDATION

Change of Character (CHoCH). CHoCH uses the body’s opposite-swing trade-through convention; the depicted close also finishes beyond. Reversal is not guaranteed.
Read the diagram step by step
- MARKET STRUCTURE
- First trade beyond the relevant opposite swing under the stated sequence; shown close is also beyond.
- This drawing also illustrates a close-confirmed variant; declare it separately.
- ILLUSTRATIVE EXAMPLE · EDUCATIONAL ONLY · NOT A TRADE RECOMMENDATION
Market structure diagram

Illustrative diagram constructed for teaching. Not real market data.
The diagram shows a constructed swing path labeled HH and HL, a break of structure, then a lower high and a lower low marking a change of character. It is constructed for teaching and is not real data.
How do you mark market structure step by step?
If two people followed the same written steps, would they mark the same chart the same way?
Work from a clean chart (any bar type works) and keep notes.
First pass: swings only. Pick one swing rule and stick to it. Mark every swing high and swing low that meets it over the period you care about. Ignore indicators and news during this first pass.
Second pass: name the sequence. Label each swing (HH, HL, LH, LL) against the previous one of its kind. Then write one word for the current state: rising, falling or sideways. If you cannot choose, “sideways” or “unclear” is a valid answer.
Third pass: note the breaks and zones. Mark the most recent BOS or CHoCH and the price where it happened. Shade the two or three zones nearest the current price. Write the date and timeframe beside your notes so you can compare them later.
To compare states at a glance:
| Label | What the swings look like | Question to ask next |
|---|---|---|
| Rising | Each high and low above the last one | Does the next pullback stop above the latest HL? |
| Falling | Each high and low below the last one | Does the next bounce stall below the latest LH? |
| Sideways | Turns clustered near the same upper and lower prices | What happens at the edges, and how is trading volume behaving there? |
| Unclear | Small, overlapping swings with mixed labels | Would a larger swing rule or a higher timeframe make the picture cleaner? |
How do timeframes change market structure?
Can a chart be rising and falling at the same time?
Structure belongs to the timeframe you read it on. A daily chart can be rising while the hourly chart inside it is falling during a pullback. Both statements are true. Write down which timeframe each description refers to. Combining timeframes on purpose is the subject of timeframes and multi-timeframe analysis.
Where does structure reading go wrong?
Which of these mistakes would be easiest to make without noticing?
- False breaks. Price pokes beyond a level and comes back. Some traders wait for a bar to close beyond the level before calling it a break; that reduces some false breaks and adds others by being late. Chart patterns looks at breakouts and false breaks in more detail.
- Changing the rule midway. Switching swing definitions after seeing the chart lets you find whatever pattern you were hoping for.
- Forcing a trend. Sideways markets produce constant label flips. Calling every flip a new trend creates noise, not information.
- News shocks. A scheduled report or surprise headline can carry price through several swings within seconds (see economic events and headlines). Structure drawn before the release may say little about the move.
- Hindsight neatness. Swings are only confirmed after the bars that follow them print, so structure always looks cleaner on an old chart than it did live.
Why write a structure description down?
What would a one-line note today let you check next month?
Writing down a structure description before drawing conclusions is a habit some traders use to keep their reading consistent. A short line is enough, for example: “1-hour, rising, BOS above last swing high, nearest zone below at the prior HL.” A trading journal is a natural home for them. Reviewing those notes later shows how often your reading held up and where your swing rule needs adjusting.
What this does not tell you about market structure
- Structure describes what price has done, not what it will do.
- A BOS does not mean continuation must follow, and a CHoCH does not mean a reversal must follow.
- Different swing definitions and timeframes give different structure for the same chart.
- Structure does not tell you why participants bought or sold.
Method in Practice: the higher low holds, or the character changes
Fictional example. John, Harbor Index futures, the prices, times, costs and results are all invented for teaching. This shows how a written plan can be built and tested. It is not a recommendation, and nothing here says how often this idea works.
Try it on a real chart. Test this idea yourself on past sessions with bar replay. Keep your own count, including the days with no trade.
The idea. Structure describes what price has done (this lesson). In an uptrend of higher highs and higher lows, John buys after a new higher low forms. His "wrong if" is a close below that higher low, which is his written definition of a change of character (CHoCH) for this plan.
John's plan
- Setup (30-minute)
- two higher highs and two higher lows. The last swing low is 100.40, the last swing high 101.60
- Enter if
- a pullback makes a new low above 100.40, then a period closes above the prior period's high. Buy.
- Wrong if
- a 30-minute close below the new higher low
- Manage
- take half at the last swing high (101.60), the rest at 102.20 or by 14:30
- Risk
- $150 maximum, costs included
Three outcomes
-
Worked: the higher low held, and a new high followed → +$150
-
Failed: a close below the new higher low → −$108, inside the limit
-
No trade: the pullback went below 100.40, so there was no higher low → $0
Show the full replays
| Item | Plan |
|---|---|
| Swing definition | A 30-minute bar with a lower low (or higher high) than the two bars on each side |
| Context | Two higher highs and two higher lows. Last swing low 100.40, last swing high 101.60 |
| Entry condition | A pullback makes a swing low above 100.40, then a 30-minute close above the prior period's high. Buy 2 at market after that close |
| Wrong if | A 30-minute close below the new swing low. Exit at market after that close |
| Management | Take profit on half at 101.60 (limit) and move the exit for the rest to the entry price (stop). Rest at 102.20 (limit). Time limit 14:30 CT |
| Risk cap and size | $150. 2 contracts when the new low is within 0.50 of the entry, otherwise 1 |
| Not trading if | Scheduled major release within the hour, or no setup by 12:00 CT |
Replay A: worked
| Time (CT) | What happened | John |
|---|---|---|
| 08:30–09:30 | Pulls back to 100.70 (a higher low) | Watching |
| 09:30–10:00 | Closes 101.05, above the prior high of 101.00 | Buys 2 at market, filled 101.10. Low 0.40 below: 2 contracts |
| 10:00–11:40 | Trades 101.60 | Sells 1 at 101.60 (limit). Exit for the other moves to 101.10 |
| 11:40–13:50 | Never back to 101.10, trades 102.20 | Sells the last 1 at 102.20 (limit) |
Result after costs: +0.50 point = +$50, +1.10 points = +$110, commissions −$10. Net +$150.
Replay B: failed
| Time (CT) | What happened | John |
|---|---|---|
| 08:30–09:30 | Pulls back to 100.75 | Watching |
| 09:30–10:00 | Closes 101.07 | Buys 2 at market, filled 101.12 |
| 10:00–10:30 | Falls, closes 100.68, below 100.75 | Wrong-if met: sells 2 at market, filled 100.63 |
| 10:30–15:00 | Falls below 100.40 too. The uptrend's structure is broken | Done for the idea |
Result after costs: 2 × −0.49 point = −$98, commissions −$10. Net −$108.
Replay C: no trade
| Time (CT) | What happened | John |
|---|---|---|
| 08:30–09:30 | Pulls back to 100.30, below the last swing low (100.40) | No higher low: plan off |
| 09:30–12:00 | Rises back to 101.20 | Watches only |
Result: $0.
Test it yourself
- Write your swing definition first (how many bars on each side). This lesson shows how this changes the structure.
- Replay every higher low in your sample. Count the ones that broke.
- Try the same plan with a different swing definition. If the structure changes, so will the results.
Where it breaks
- A break of structure doesn't mean continuation must follow.
- Different swing definitions give different structure for the same chart.
- Structure is clear in hindsight and messy in real time.
Calculators: position sizerisk/rewardexpectancy
Reflection question: How many bars on each side make a swing point in your plan, and why that number?
Check yourself
Reflect on these; there is no score.
- A daily chart shows an uptrend, and the 15-minute chart shows a downtrend. Is one of them wrong? Hint: structure belongs to a timeframe.
- What is the difference between a break of structure and a change of character? Hint: continuing the sequence versus breaking it.
- Why might two traders mark different swing highs on the same chart? Hint: how many bars on each side define a swing.
- What would you write in a journal to describe the current structure of a chart you follow? Hint: timeframe, sequence, last break, key levels.
- Using the fictional 100.00 reference and H100.25/C99.75 bar, do trade-through and close-above rules agree?
Reflect on your own process
- Which swing rule does your written plan use, and how many bars on each side does it require?
- Does your journal note say whether you used a trade-through or close-beyond rule for each break you marked?
- When you review old structure notes, how do you account for swings that were not yet confirmed when you wrote them?
- How many bars on each side make a swing point in your plan, and why that number?